


Canadian advisors are underfunding their own growth, and the numbers prove it

By Patrick MacLean July 8, 2026

Advisor Marketing Spend:

Run the numbers

Ask a Canadian advisor why they spend a third of what their American counterparts spend on marketing and you will usually hear some version of the same answer: the US market is bigger, the books are bigger, the clients are wealthier, so the comparison is not fair.


The data says otherwise. Canadian advisors run books that are as large as, and in several channels larger than, the average American book. What they do not run is a growth budget to match. This article puts real numbers on both sides of the border and normalizes them, so the comparison is fair. It ends with a benchmark you can use to decide what a serious growth budget looks like for a book your size.


The spend gap

Broadridge runs parallel advisor marketing surveys in both markets, which makes it the cleanest available comparison.


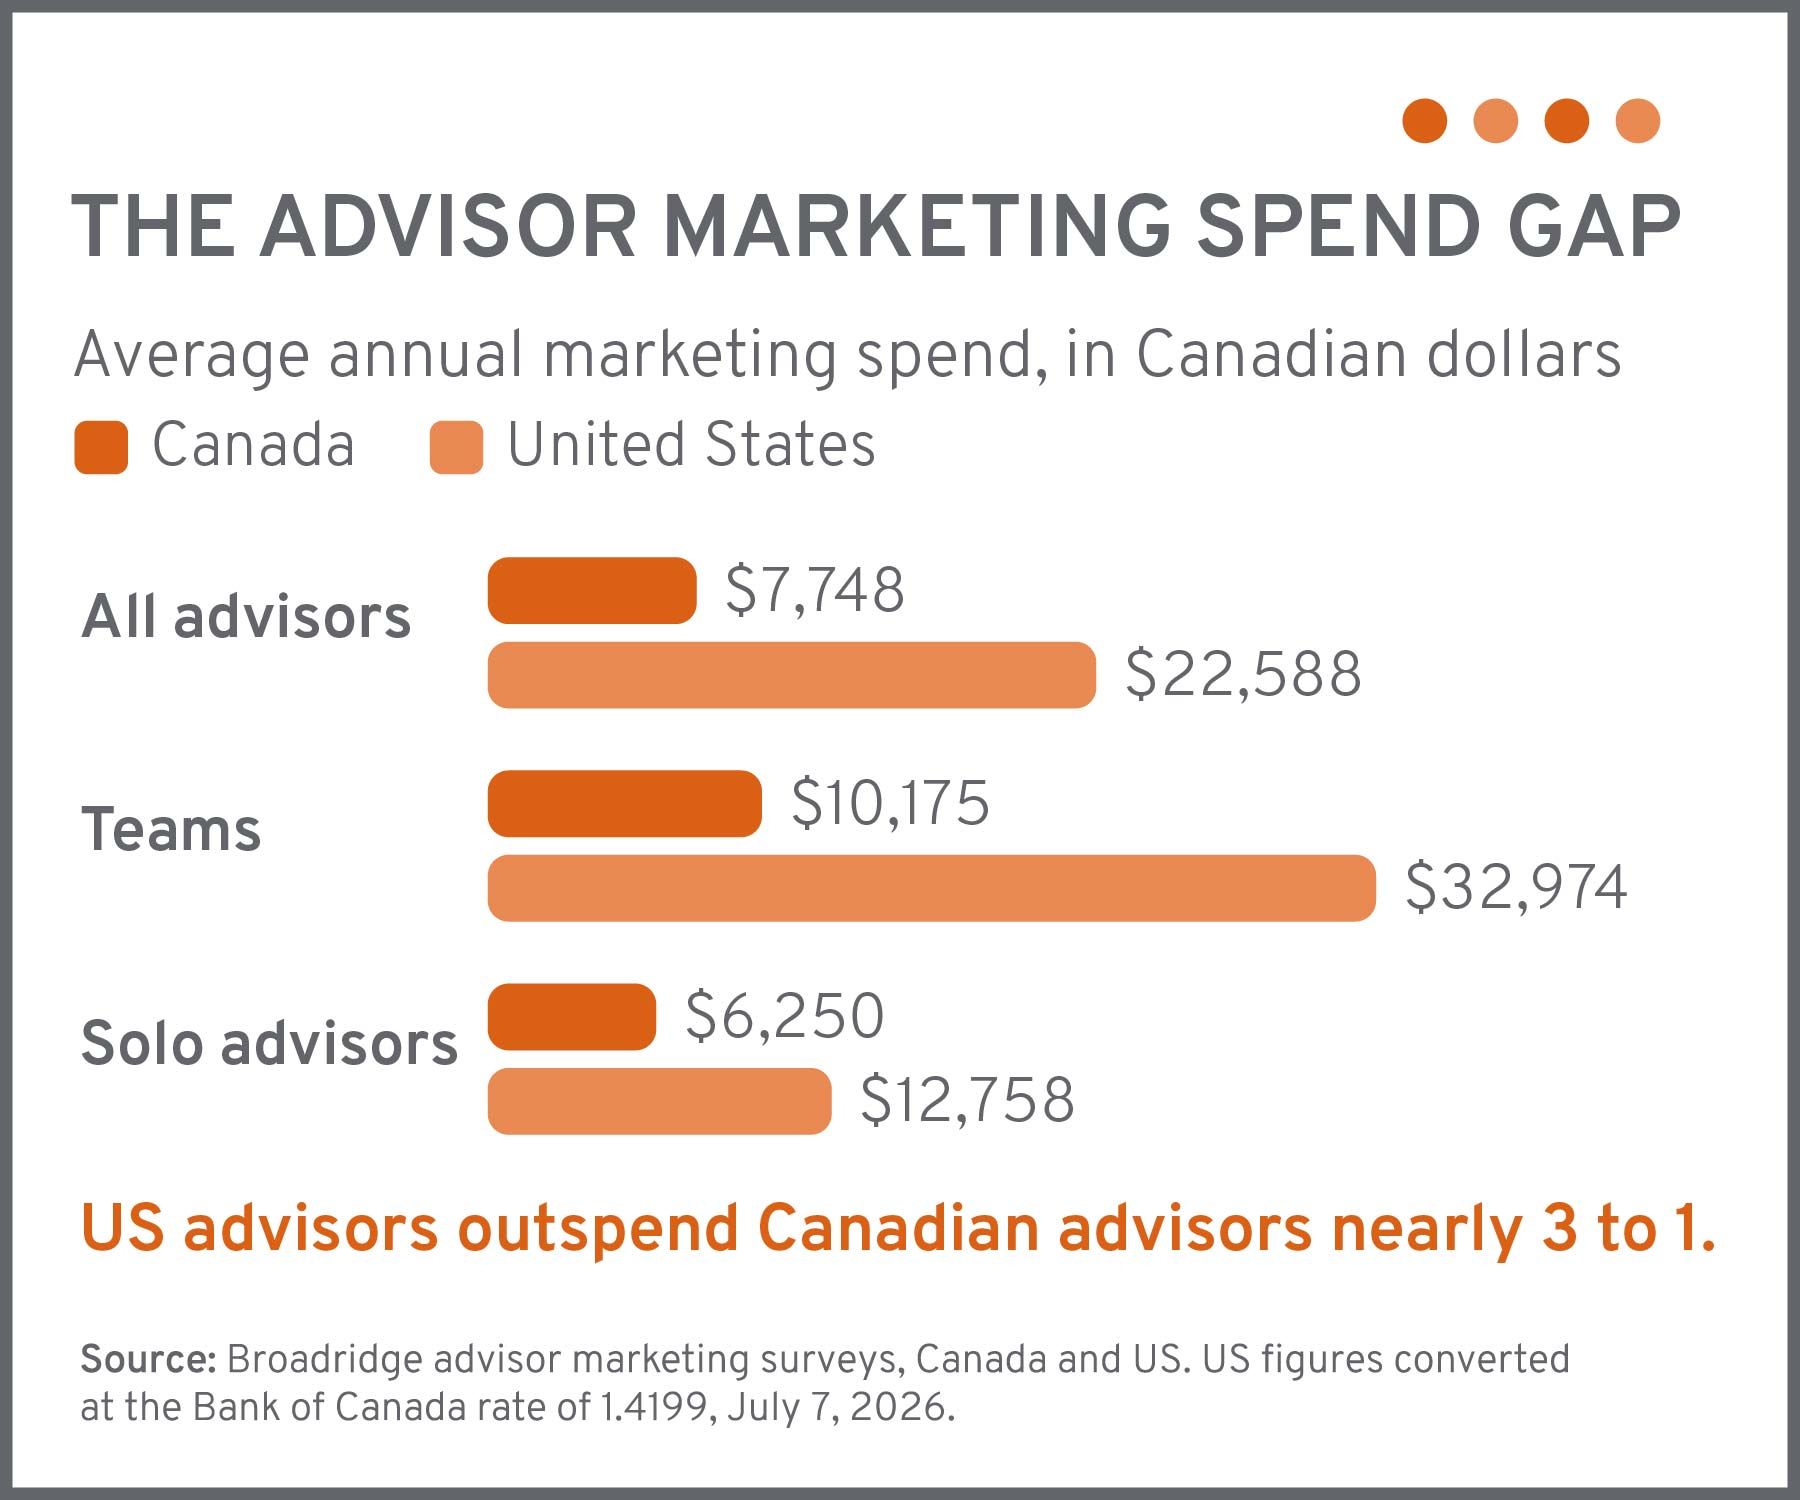
In Canada, advisors spend an average of $7,748 per year on marketing. Teams spend $10,175 and solo advisors spend $6,250, according to Broadridge’s Canadian Financial Advisor Marketing Trends Report, based on a survey of 131 Canadian advisors with at least $10 million in AUM, drawn primarily from the dealer and full-service brokerage channels.


In the US, the average advisor spent US$15,908 on marketing, about C$22,588 at the Bank of Canada rate of 1.4199 on July 7, 2026. Teams averaged US$23,222 (about C$32,974) and solo advisors US$8,985 (about C$12,758).


In Canadian dollar terms, the average American advisor outspends the average Canadian advisor by nearly three to one.

One honest caveat: the US median is US$6,250, which tells you the American average is pulled up by teams and growth-focused firms. But that is precisely the point. The US has a large cohort of advisors treating marketing as a growth investment. Canada, so far, does not.


First, define who we are talking about

Canadian advisors work in three distinct channels, and only two of them are relevant here. Brokerage advisors work at full-service investment dealers, including bank-owned firms such as RBC Dominion Securities and BMO Nesbitt Burns, the banks’ private wealth divisions and independents such as Raymond James and Richardson Wealth. Dealer advisors work at mutual fund dealers, the traditional home of the independent advisor. Retail bank advisors work in branches, where the bank supplies the pipeline. Branch advisors inherit their prospects; this article is about advisors who need to build a pipeline themselves.


The book size myth

Here is where the “unfair comparison” argument falls apart.


Investment Executive’s 2025 Report Card research found the average Canadian brokerage advisor manages $301.3 million and the average dealer advisor manages $93 million, with books growing in both channels year over year.


For the US, Cerulli Associates reported US$31.3 trillion in retail advisor-managed assets across 283,137 advisors at the end of 2023. That implies about US$110.5 million per advisor, or roughly C$157 million. Note that the Cerulli figure spans every US channel, including bank and wirehouse advisors, so treat it as an all-market average rather than an independent-channel benchmark.


Read those numbers again. The average Canadian brokerage book is nearly double the American book. The two data sets are not perfectly matched, since Investment Executive surveys established advisors while the Cerulli figure covers every registered advisor, so treat the comparison as directional. But even on the most conservative reading, using only the Canadian dealer channel at $93 million, the gap in book size is nowhere near large enough to explain a three-to-one gap in marketing spend.


Spend per million: the fair comparison

Normalize spending against assets and the gap becomes hard to defend.

Market Average spend AUM basis Spend per $1M AUM
Canada, brokerage channel $7,748 $301.3M ~$26
Canada, dealer channel $7,748 $93M ~$83
US, all channels ~C$22,588 ~C$157M ~C$144

Broadridge does not report spend by channel; the survey average is applied to both, which is reasonable given the sample was drawn primarily from those two channels.


The average Canadian advisor invests somewhere between $26 and $83 per year per million dollars of assets to grow and protect a book generating, at a conservative 75 basis points (bps), about $7,500 in annual revenue per million. That is a fraction of one per cent of revenue. It is not a growth budget. It is barely a maintenance budget.


What acquiring a client actually costs

Broadridge’s Canadian data shows advisors onboarding an average of 15 new clients per year at $531 of marketing spend per new client. Be careful with that number. It is total marketing spend divided by every new client onboarded, from any source, including referrals and word of mouth. It is not a customer acquisition cost.


The distinction matters because referrals, not marketing, are doing most of the work in that figure. Broadridge’s own research shows referred prospects convert in 1.6 months while marketing-sourced prospects take 3.7.


A true customer acquisition cost (CAC) counts only the clients a marketing program actually produces, and the research on that is consistent: digital marketing programs for independent US advisors run US$2,500 to $4,500 per acquired client, according to Kitces Research and the Schwab RIA Benchmarking Study, roughly $3,500 to $6,400 in Canadian dollars, with single-channel cold outreach programs in a similar $3,500 to $6,500 range. Canadian program costs tend toward the lower end of those ranges because agency and management costs run lower here, even though ad platforms price in US dollars.


Now run the math. At a realistic CAC near $3,500, the average Canadian marketing budget of $7,748 funds about two marketing-sourced clients per year. Everything else has to come from referrals. That is exactly what the data shows is happening, and it is fine, right up until the referral flow slows, the book ages or a growth target appears.


What a respectable growth budget looks like

Averages tell you what advisors do. Benchmarks should tell you what works. The best available research here comes from Kitces Research, whose 2024 advisor marketing study found that growth-oriented firms spend about 3.2 per cent of revenue on hard marketing expenses, roughly US$12,000 for the typical firm. The same research found about 71 per cent of total marketing cost is advisor and staff time rather than dollars, which means the all-in cost of growth is far higher than the invoice total.


Translate those revenue percentages into per-AUM terms at a 75-bps revenue yield and you get a usable framework:

Growth posture Hard-dollar budget Per $1M AUM What it funds
Maintenance 1.0-1.5% of revenue $75-$113 Client communications, basic website, light social, newsletter
Baseline growth 2.0-3.2% of revenue $150-$240 Consistent content, email, social, events, light paid campaigns
Active acquisition 4.0-6.0% of revenue $300-$450 Lead generation, paid media, niche campaigns, landing pages, CRM reporting

Our view: a defensible benchmark for a Canadian independent advisor who is serious about growth is $150 to $300 per $1 million of AUM per year in hard marketing spend. In dollars:

Book size Conservative growth Stronger growth
$50M $7,500/year $15,000/year
$100M $15,000/year $30,000/year
$150M $22,500/year $45,000/year
$300M $45,000/year $90,000/year

Against that yardstick, the average dealer advisor spending the survey average of $7,748 on a $93 million book is funding basic visibility, not acquisition, and the average brokerage advisor is running a $300 million book on the marketing budget of a $50 million book. A $100 million to $150 million advisor who wants measurable growth should be planning for $15,000 to $45,000 per year before counting their own time.


Why the underspending persists

The gap is not really about money. Broadridge’s Canadian research points to three structural causes.

  1. Advisors spend an average of 1.7 hours per week on marketing, and 89 per cent say finding the time is a challenge.
  2. Only one in five has a defined marketing strategy.
  3. And most advisors still assume referrals will carry growth on their own.


The cost of that last assumption is measurable. Advisors with a defined marketing strategy generated 175 per cent more monthly leads, onboarded 69 per cent more clients and were 46 per cent more confident in their growth than advisors without one.


The problem is not that marketing fails Canadian advisors. It is that most have never funded it at a level where it could succeed.


The bottom line

The next time someone tells you cross-border marketing comparisons are unfair because American books are bigger, you can tell them the average Canadian brokerage book is nearly twice as large. The difference is not market size. It is that a meaningful share of US advisors treat marketing as a growth investment with an expected return, while most Canadian advisors treat it as an expense to minimize.


For a Canadian advisor, that is an opportunity. In a market where the average competitor spends under $100 per million of assets and dedicates under two hours a week to marketing, a properly funded, consistently executed program does not need to be extraordinary to stand out. It just needs to exist.


If you want to see where your own spend sits against these benchmarks, start with the simple math: your AUM, times $150 to $300 per million, is your baseline growth budget. If your current spend is a fraction of that, you now know why the phone is not ringing.


inSymmetry works with Canadian advisors and dealer firms to build compliant, measurable growth programs. If you would like a benchmark review of your current marketing spend against your growth goals, get in touch.


Figures are drawn from published industry research and are subject to the methodologies and sample sizes of each source. Currency conversions use the Bank of Canada daily rate of 1.4199 (July 7, 2026). This article is for information only and is not investment advice.


Sources

Broadridge, Canadian Financial Advisor Marketing Trends Report 2024: https://info.advisorstream.com/financial-advisor-marketing-trends-report-2024-canada


Broadridge, Financial Advisor Marketing Trends Report (US), fifth annual survey: https://www.broadridge.com/press-release/2024/fifth-annual-broadridge-survey


Investment Executive, Advisors’ Report Card 2025: A growth year for the average advisor: https://www.investmentexecutive.com/report-cards/advisors-report-card-2025/a-growth-year-for-the-average-advisor/


Cerulli Associates, US advisor headcount and advisor-managed assets: https://www.cerulli.com/press-releases/the-financial-advisor-industry-has-a-headcount-problem


Kitces Research, advisor marketing strategy and client acquisition cost: https://www.kitces.com/blog/advisor-marketing-strategy-client-acquisition-cost-efficient-marketing-time-dollar-cost/


Kitces Research, client acquisition costs for financial advisor marketing strategies: https://www.kitces.com/blog/client-acquisition-cost-financial-advisor-marketing-efficiency-lifetime-client-value-lead-generation-satisfaction/


Charles Schwab, RIA Benchmarking Study 2024: https://www.schwab.com/content/dam/schwab/public/financial-services/insights/benchmarking-study.pdf


Investipal, why customer acquisition costs are rising for financial advisors: https://www.investipal.co/blog/why-customer-acquisition-costs-are-rising-for-financial-advisors-and-what-to-do-about-it/

What should you be spending

Canadian advisors spend a third of what US advisors do when marketing their business. See where your budget lands against your book.


Insights to fuel your practice

Sign up to get industry insights, trends, and more in your inbox.

Contact Us

SHARE THIS

Latest Posts

Colourful heads on a wood background showing the concept of identity
By Kathryn Ashby July 22, 2026
Your logo gets you recognized. It doesn’t get you chosen. Part one of two on what brand really is and why it decides who wins in a crowded market.